Case study
The Taquari broke every record. The forecast saw it a week out.
Published 2026
In late April and early May 2024 the worst floods in Rio Grande do Sul's history swept southern Brazil, killing more than 180 people and displacing three-quarters of a million. Two weeks of relentless rain drove the Taquari River past levels never seen in 150 years of measurement. It was a large, sustained, rainfall-driven river flood, exactly the kind a global ensemble resolves days ahead. We reconstructed what a probabilistic, catchment-scale warning would have shown, run by run.
1 · What happened
Two weeks of rain, and a river past every record
From 24 April a stalled weather pattern, a cold front held in place by high pressure and fed by a warm, moist plume from the Amazon, parked over Rio Grande do Sul and rained for days. Parts of the state took around 420 mm, roughly three months of rain, in a fortnight. The Taquari-Antas basin, draining the Serra Gaúcha plateau, responded with a catastrophic flood: on 2 May 2024 the river passed all-time records at Muçum (25.6 m, about 13,241 m³/s), Lajeado (33.7 m) and Estrela (32.1 m, about 23,472 m³/s), rising above 30 m for the first time in 150 years of measurement. Across the state the floods killed more than 180 people, displaced around 775,000, and inundated an area the size of a small country.
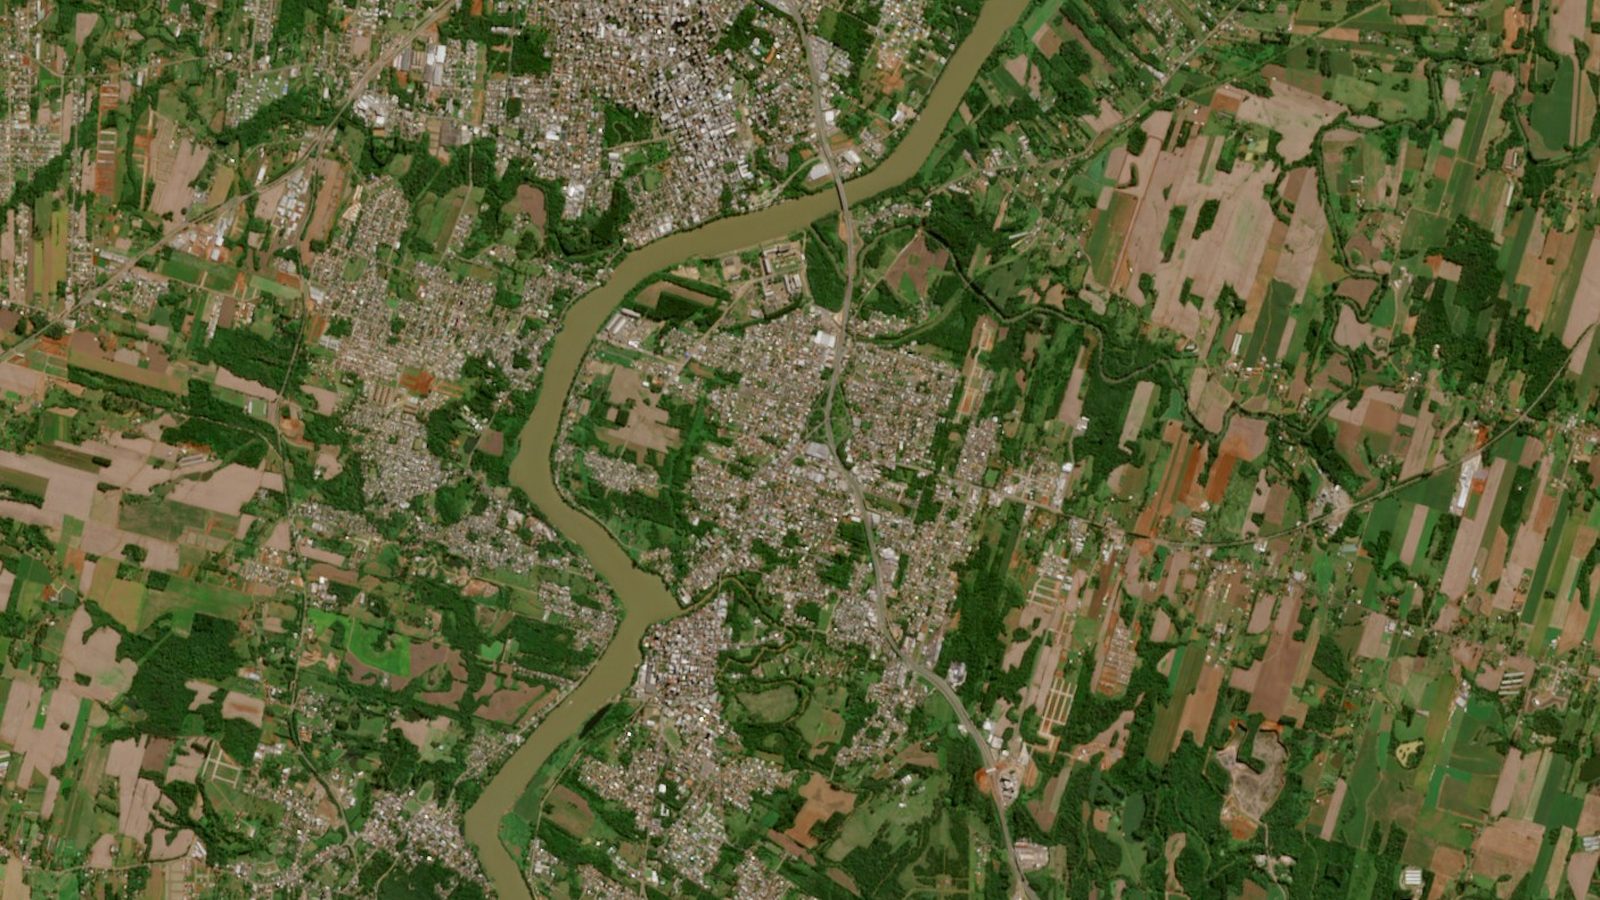
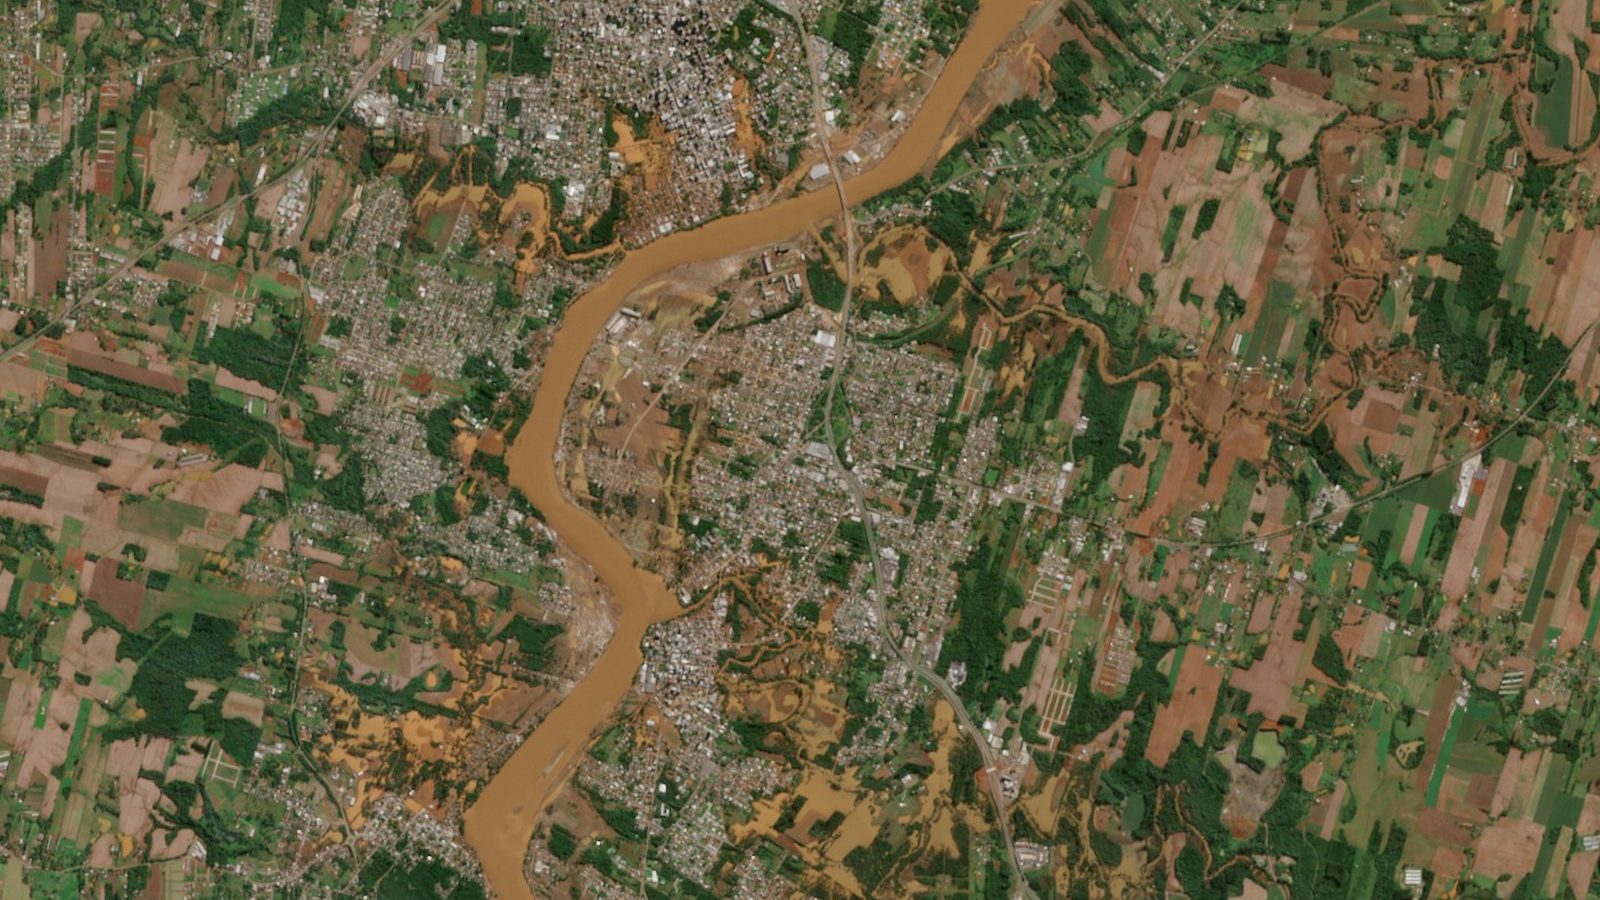 Before · 21 AprAfter · 6 May
2 · The forecast, run by run
Watch a near-certain warning hold for a week
Each ICON ensemble run (40 members, every 12 h) is fed through the Taquari catchment model. Drag the slider, or press play, to step from six days out to the eve of the Estrela peak and watch the flood probability, the ensemble hydrograph against flood thresholds, and the warning status. Select a reach down the main stem, from the Serra Gaúcha headwaters through Muçum and Lajeado to Estrela, to read the forecast at that point and watch the wave grow downstream.
Loading interactive forecast replay…
3 · Forecast vs reality
Warning from six days out, at 100% by four
Probability of a ≥ 2-yr flood vs lead time
Probability, not the median
The chart shows one number per run: the chance that flow tops the 2-year flood level at Estrela. It reaches 80% six days out and 100% from four days ahead, and holds there. The “missed” label in the run table is a deliberate, honest footnote: it compares the ensemble median rainfall against what actually fell, and the median under-forecast the sheer total, IMERG put the observed basin rain near 240 mm while the median forecast was closer to 60 mm. Yet 60 mm on an already saturated 21,849 km² basin is still a certain flood, which is why the exceedance probability, the share of the 40 members that cross the flood level, sat at 100% even while the median trailed the extreme. For flood risk the probability is the signal, not the median, which is why operational services such as GloFAS and EFAS verify on exactly this.
4 · What this means
The clearest warning in the set
Run after run, from six days out, the ensemble placed the stalled rain over the Serra Gaúcha and the catchment model routed it into a near-certain flood warning at Estrela, on a 21,849 km² basin that went on to set a 150-year record. This is the case RA-FEWS is built for, and its strongest result: a large, synoptically-forced, rainfall-driven river flood, resolved and warned days in advance. The science offered most of a week of lead time; what was missing in 2024 was a system to turn it into a local, catchment-specific, probabilistic warning people could act on. That is RA-FEWS.
Event Reconstruction Challenges
These challenges are specific to reconstructing a 2024 event from the only public historical archive. None of them apply to live RA-FEWS operation: in production the system ingests native-resolution operational forecasts, uses thresholds calibrated per catchment, and is not constrained by a coarse research archive.
Forecast. DWD ICON-EPS (40 members) from the ECMWF/TIGGE archive, every 12 h across the 120 h horizon; observed rainfall from NASA GPM-IMERG; both run through the operational RA-FEWS catchment model (SCS-CN → unit hydrograph → variable-parameter Muskingum-Cunge routing) over the 11 Taquari-Antas sub-basins to Estrela. At 21,849 km² the basin spans many grid cells, so the raw forecast is used directly, with no neighbourhood upscaling.
Rainfall verification levels are provisional, set for the humid Rio Grande do Sul regime rather than fitted to a rainfall-frequency analysis. The ensemble median under-forecast the rainfall total (near 60 mm against an observed basin mean near 240 mm), so the deterministic verification reads as under-warned even though the probabilistic warning was near-certain; that is the expected behaviour of a median against a skewed extreme, and the reason flood risk is read from the exceedance probability.
Flood thresholds are provisional. The HQ2-HQ50 levels (2,500-12,000 m³/s at Estrela) are placeholders for readability, not a gauged flood-frequency analysis; per-reach values are area-scaled from the outlet. The gauged 2024 peak (about 23,472 m³/s) exceeded even the HQ50 shown here, a flood well beyond a 50-year event.
Data and references. DWD ICON-EPS via TIGGE (CC BY 4.0); GPM IMERG, NASA; satellite scenes contain modified Copernicus Sentinel data (2024). The observed peak is gauge-anchored: Estrela recorded about 23,472 m³/s (32.1 m) and Muçum about 13,241 m³/s on 2 May 2024, per Rio Grande do Sul monitoring and the published flood analyses. Cycles issued after the ~1 May onset are omitted from the plot.
References
- 2024 Rio Grande do Sul floods, overview and gauge records (2024)
- The exceptional hydrological disaster of April to May 2024 in southern Brazil, RBRH / ABRHidro (2024)
- The May 2024 flood disaster in southern Brazil: causes, impacts and volume estimation, Geophysical Research Letters (2024)
- Jornal do Comércio, Rio Taquari reaches 30 m for the first time in history (2 May 2024)
- World Weather Attribution, climate change and El Niño behind the extreme precipitation in southern Brazil (2024)