Case study
The Swat tore through the valley. The forecast saw it days out.
Published 2026
In late August 2022, Pakistan's monsoon super-floods sent the Swat River raging through its valley, sweeping away hotels, bridges and homes from Kalam to Mingora and on toward Nowshera. The rain was part of a vast, well-forecast monsoon surge, and ensemble forecasts carried a near-certain flood signal for days. We reconstructed what a probabilistic, catchment-scale warning would have shown, run by run, as the flood built over the Swat basin.
1 · What happened
A monsoon on steroids, and a valley in the way
The 2022 monsoon dumped historic rain across Pakistan; by season's end a third of the country was under water, more than 1,700 people had died and some 33 million were affected. In the last week of August the Khyber Pakhtunkhwa pulse turned catastrophic: record rain over the upper Swat catchment (Kalam, Bahrain, Madyan) on 25-26 August sent an extreme flood wave down the valley, tearing away hotels, bridges and whole riverside bazaars. At Amandara Headworks, the outlet of this reconstruction, the Swat set a record discharge of roughly 7,644 m³/s on 26 August, a flood of about 425-year return period; that night three of the eight bays of Munda Headworks downstream were washed away, and the wave routed on to Charsadda and Nowshera via the Kabul confluence.
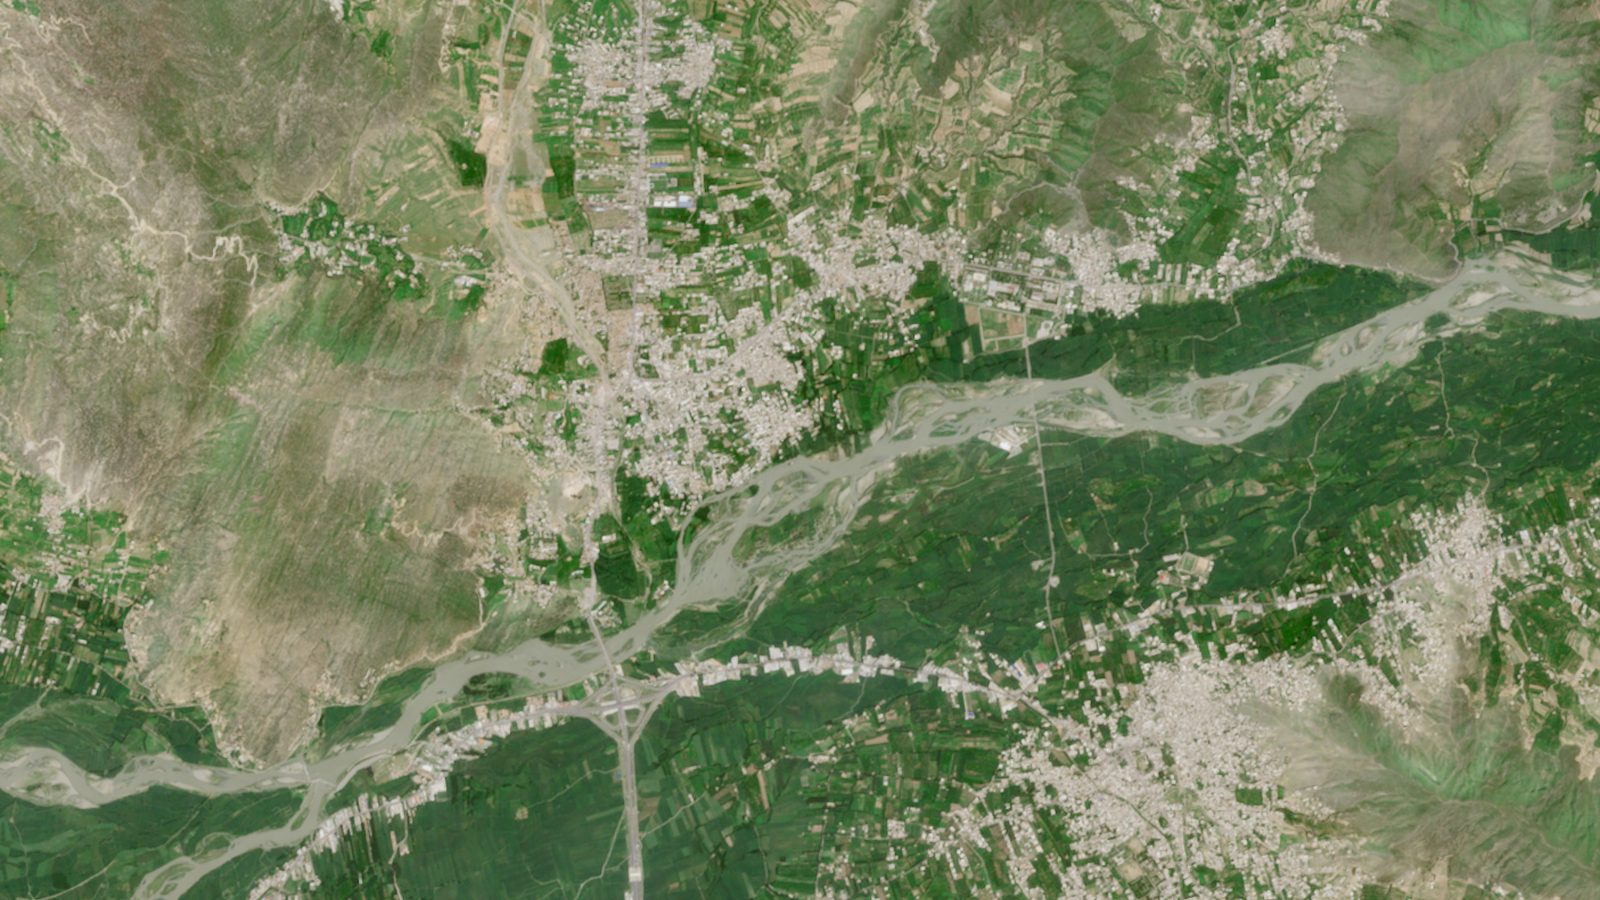
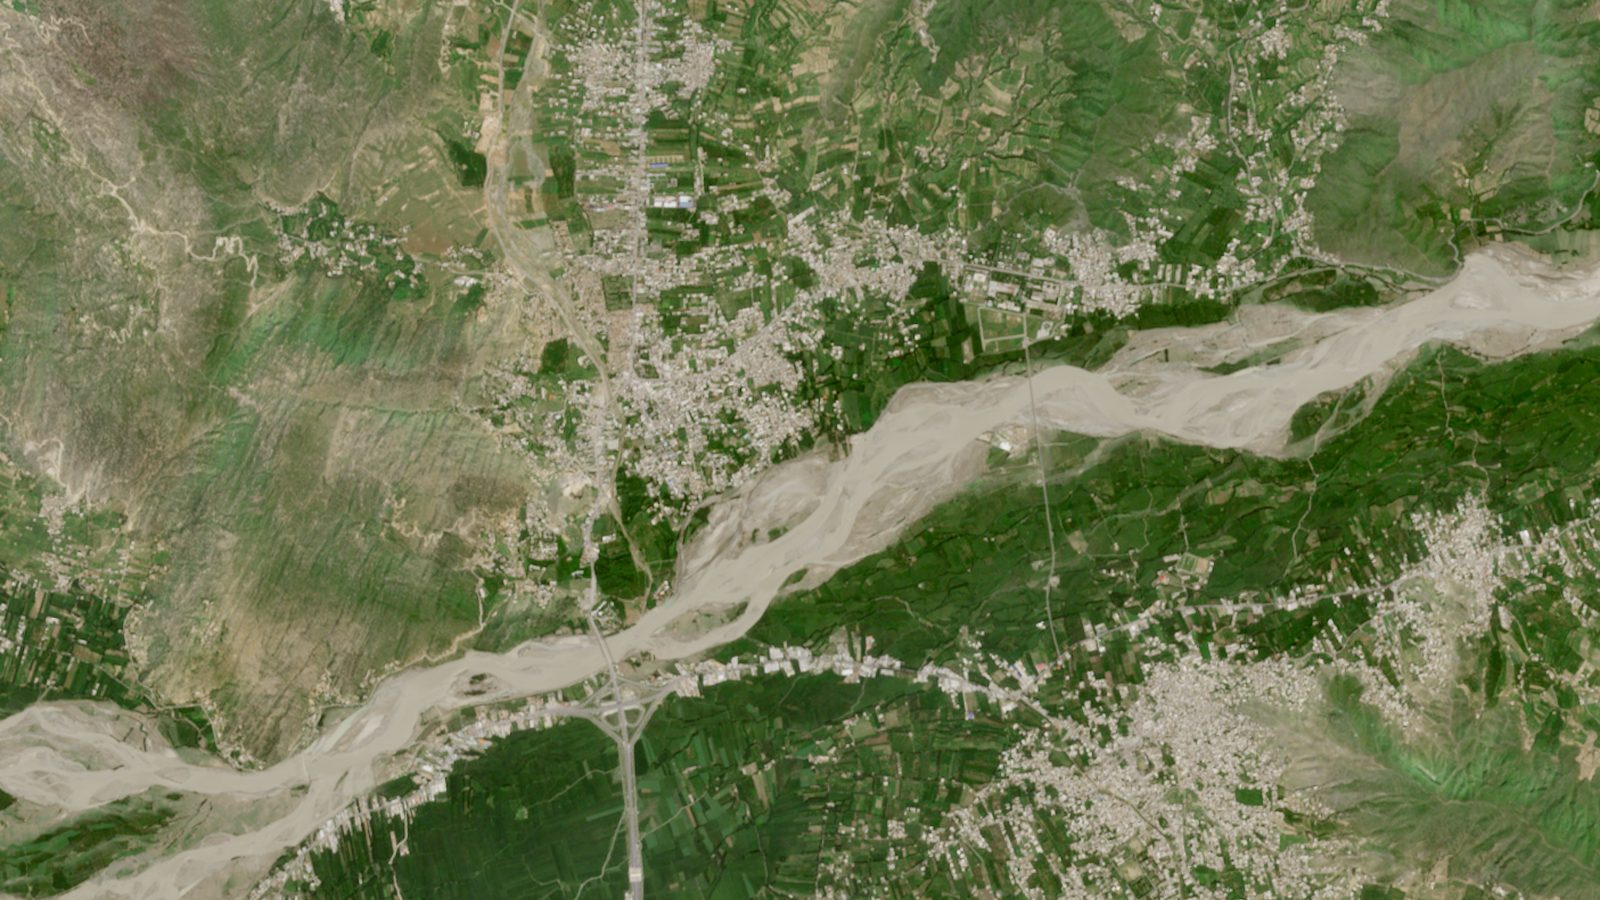 Before · 13 AugAfter · 7 Sep
2 · The forecast, run by run
Watch the warning lock in days before the peak
Each ICON ensemble run (40 members, every 12 h) is fed through the Swat catchment model. Drag the slider, or press play, to step from five days out to the eve of the Amandara peak and watch the flood probability, the ensemble hydrograph against flood thresholds, and the warning status change. Select a reach down the main stem, from the Hindu Kush headwaters to Amandara, to read the forecast at that point and watch the wave grow downstream.
Loading interactive forecast replay…
3 · Forecast vs reality
Near-certain days ahead, and the crest on the right day
Probability of a ≥ 2-yr flood vs lead time
How to read the ensemble: probability, not the median
The chart on the left shows one number per forecast run: the chance that flow tops the 2-year flood level at Amandara. An ensemble is 40 parallel forecasts of the same weather; rather than ask whether the single middle member crosses a threshold, you count how many members do, and that share is the exceedance probability. Here the members agreed early and strongly: the probability climbed past 70% more than five days out and reached 100% two to three days ahead, the forecast rainfall matched what IMERG later observed, and the modelled crest fell on 26 August, the gauged peak day. So the run verifies as hit after hit. Operational systems such as GloFAS and EFAS score on exactly this exceedance probability rather than a single median hit or miss.
4 · What this means
The warning was early, and it was right.
Run after run, the ensemble placed the monsoon's heavy rain over the Swat headwaters and the catchment model routed it into an escalating, near-certain flood warning at Amandara, climbing past 70% more than five days out and reaching 100% about two to three days ahead, while the forecast rainfall matched what actually fell and the modelled crest landed on 26 August, the day of the gauged peak. The warning was early and on time. This is the case RA-FEWS is built for: a large, rainfall-driven monsoon flood that a global ensemble resolves well, turned into a local, catchment-specific, probabilistic warning days before the water arrived. The science offered the lead time; what was missing in 2022 was a system to put it in front of the people in the valley. That is RA-FEWS.
Event Reconstruction Challenges
These challenges are specific to reconstructing a 2022 event from the only public historical archive. None of them apply to live RA-FEWS operation: in production the system ingests native-resolution operational forecasts, uses thresholds calibrated per catchment, and is not constrained by a coarse research archive.
Forecast. DWD ICON-EPS (40 members) from the ECMWF/TIGGE archive, every 12 h across the 120 h horizon; observed rainfall from NASA GPM-IMERG; both run through the operational RA-FEWS catchment model (SCS-CN → unit hydrograph → variable-parameter Muskingum-Cunge routing with channel transmission loss) over the Swat sub-basins to Amandara. At 5,582 km² the basin spans several grid cells, so the raw forecast is used directly, with no neighbourhood upscaling.
Rainfall verification levels are event-anchored. IMERG's zone-mean 24 h peak (~48 mm) drove the real flood, so the severe (“red”) level is set near that value; satellites under-catch orographic monsoon rain, so the true totals were higher still. This calibration is provisional, not a rainfall-frequency analysis.
Flood thresholds are provisional. The HQ2-HQ50 levels (800-4,000 m³/s at Amandara) are placeholders for readability, not a gauged flood-frequency analysis; per-reach values are area-scaled from the outlet. The real 2022 peak (~7,644 m³/s) far exceeded even the HQ50 shown here: the ensemble captures the flood's occurrence and timing well, while its absolute discharge is damped by satellite- and ensemble-rainfall under-catch. Read the probabilities as rising flood risk, not calibrated magnitude.
Data and references. DWD ICON-EPS (40 members) via the ECMWF/TIGGE archive (CC BY 4.0); observed rainfall from NASA GPM-IMERG; satellite scenes contain modified Copernicus Sentinel data (2022). The observed peak is gauge-anchored: Amandara Headworks recorded ~7,644 m³/s on 26 August 2022 (~425-year return period) per KP Irrigation and the NHESS (2025) Swat flood study. Cycles issued after the ~25 Aug onset are omitted from the plot.
References
- Ahmad et al., “Dynamics and impacts of monsoon-induced geological hazards: a 2022 flood study along the Swat River in Pakistan”, Natural Hazards and Earth System Sciences 25, 1071 (2025)
- “Assessment of climate change impact on inflows to Amandara headworks using HEC-HMS and ANNs”, Journal of Umm Al-Qura University for Engineering and Architecture (2024)
- The Nation, “Rescuers struggle as Kabul, Swat, Indus rivers continue to run furious” (28 August 2022)
- The Express Tribune, “Evacuation orders for two K-P districts as Munda bridge collapses” (August 2022)
- Pakistan National Disaster Management Authority (NDMA), Monsoon 2022 Daily Situation Reports (August to September 2022)
- NASA Earth Observatory, “Devastating Floods in Pakistan” (2022)