Case study
Storm Daniel hit Derna. The forecast saw it coming.
Published 2024
On 11 September 2023 a wadi flash flood and two dam failures destroyed much of Derna, Libya. The meteorology was not a surprise: global forecasts carried the signal for days. We reconstructed what a probabilistic, catchment-scale warning would have shown, run by run, in the week before the flood.
1 · What happened
A medicane over a mountain wadi, and two failing dams
Storm Daniel intensified into a Mediterranean tropical-like cyclone and made landfall near Benghazi on 10 September 2023. Extreme orographic rainfall fell over the Jabal al-Akhdar highlands and drained into Wadi Derna, a normally dry ~548 km² catchment that ends at the city. Late on 10 September the reservoirs filled; in the early hours of 11 September the Abu Mansour and Al-Bilad dams failed in sequence, releasing a dam-break wave that destroyed much of Derna.
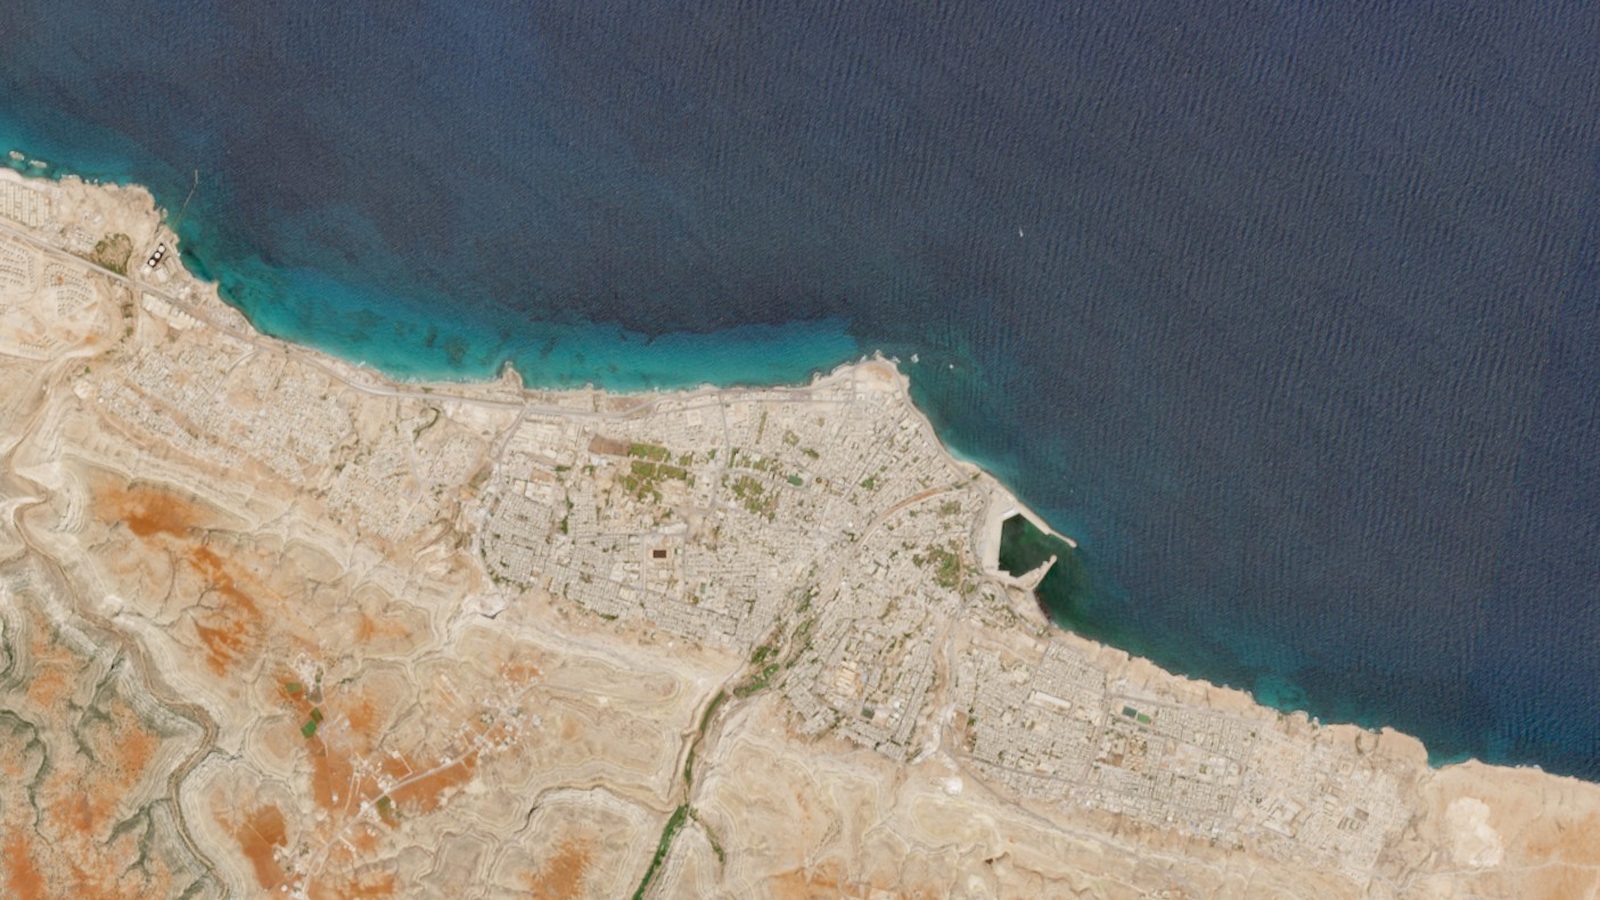
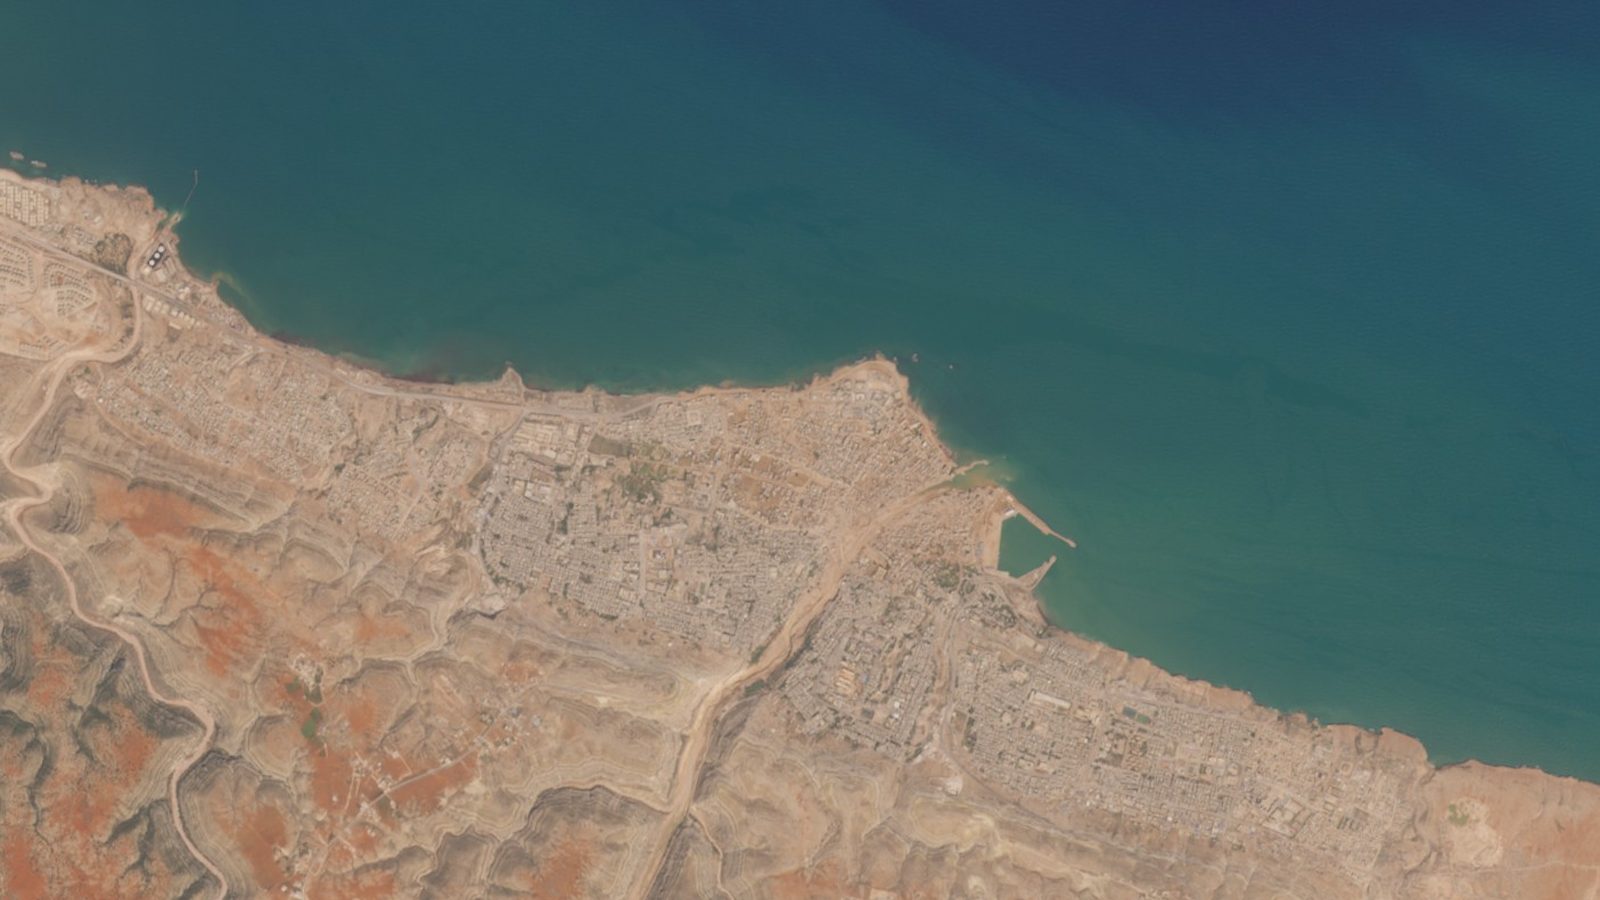 Before · 7 SepAfter · 22 Sep
2 · The forecast, run by run
Watch the warning escalate as the event approaches
Each ICON ensemble run (40 members, every 12 h) is fed through the Wadi Derna catchment model. Drag the slider, or press play, to step from five days out to the eve of the flood and watch the flood probability, the ensemble hydrograph against flood thresholds, and the warning status change. Select an outlet along the wadi, the never-built third dam, the Abu Mansour dam, or the Al-Bilad dam at the city, to read the forecast, thresholds and exceedance at that point.
Loading interactive forecast replay…
3 · Forecast vs reality
The probability climbed days before the flood
Probability of a ≥ 2-yr flood vs lead time
How to read the ensemble: probability, not the median
The chart on the left shows one number per forecast run: the chance that flow tops the 2-year flood level. An ensemble is 40 parallel forecasts of the same storm. Rather than ask whether the single middle member crosses a threshold, you count how many members do; that share is the exceedance probability. Days ahead the members disagree and the probability is modest, so a single deterministic line can look like a miss. As the storm nears, the members converge and the probability climbs. A flood service acts on that rising probability, which is why operational systems such as GloFAS and EFAS verify on exceedance probability rather than a median hit or miss.
4 · What this means
The signal was there. The warning is the product.
Run after run, the ensemble placed heavy rain on Derna and the catchment model converted it into an escalating, probabilistic flash-flood warning: advisory four days out, a formal warning 2.5 days out, holding through to the event, with a predicted onset within hours of the dam failures. The science was available days ahead; what was missing in 2023 was a system to turn it into a local, catchment-specific, probabilistic warning people could act on. That is RA-FEWS.
Event Reconstruction Challenges
These challenges are specific to reconstructing a 2023 event from the only public historical archive. None of them apply to live RA-FEWS operation: in production the system ingests native-resolution operational forecasts, uses thresholds calibrated per catchment, and is not constrained by a coarse research archive. Nothing in this section describes how the operational service performs.
Forecast. DWD ICON-EPS (40 members) from the ECMWF/TIGGE archive, every 12 h across the 120 h horizon; observed rainfall from NASA GPM-IMERG; both run through the operational RA-FEWS catchment model (SCS-CN → unit hydrograph → routing) for Wadi Derna.
Dam break is out of scope. RA-FEWS forecasts rainfall-driven flash floods. The disaster's magnitude was a dam-break wave from two failing dams, a structural cascade outside any hydrometeorological model. The observed natural flash flood is therefore far smaller than the real catastrophe: the catastrophe was structural, not meteorological.
Flood thresholds are illustrative. The HQ2-HQ50 levels are placeholders for readability, not derived from this event. A single, dam-break-amplified extreme is a poor basis for return-period thresholds; proper values need a flood-frequency analysis (e.g. a multi-decade IMERG-driven simulation). Each outlet's levels are area-scaled from the city outlet by cumulative drainage area, so the upstream dam sites carry proportionally lower thresholds. Read the probabilities as rising flash-flood risk, not calibrated design floods.
Resolution and neighbourhood forcing. The only public historical ensemble archive (TIGGE) is coarse, 0.5° (~55 km), and Derna's catchment is smaller than one grid cell, so the storm peak fell on the neighbouring cell. For this case study only, a neighbourhood-maximum (±1 cell) represents that location uncertainty. The operational system ingests native-resolution input and does not need this; rainfall verification still uses the raw forecast.
Data: DWD ICON-EPS via TIGGE (CC BY 4.0); GPM IMERG, NASA. Event figures from ECMWF, Science Advances and Nature Communications (2025). The post-onset 11 Sep 00 UTC run is omitted from the plot.
References
- Shmilovitz et al. (2025), Anatomy of a foreseeable disaster: Lessons from the 2023 dam-breaching flood in Derna, Libya. Science Advances
- How extreme rainfall and failing dams unleashed the Derna flood disaster (2025). Nature Communications
- ECMWF Newsletter 179: Medicane Daniel, an extraordinary cyclone with devastating impacts
- ASDSO Dam Failures: Abu Mansour & Al-Bilad Dams (Libya, 2023)